
Nobel Prize-winning Yale University professor Robert J. Shiller has rightly said in his book "Irrational Exuberance" - "The ability to focus attention on important things is a defining characteristic of intelligence." It is quite possible that this definition of intelligence has led to the nomenclature of processes, architectures, and technologies that convert raw business data into meaningful business insights as "Business Intelligence". A business intelligence dashboard is a data visualization tool which through its customizable interface and the ability to pull real-time data from multiple sources offers the user an array of important business insights in the form of metrics and key performance indicators (KPIs). Carly Fiorina, Former CEO of HP sums up the purpose of a BI Dashboard, "The goal is to turn data into information, and information into insight."
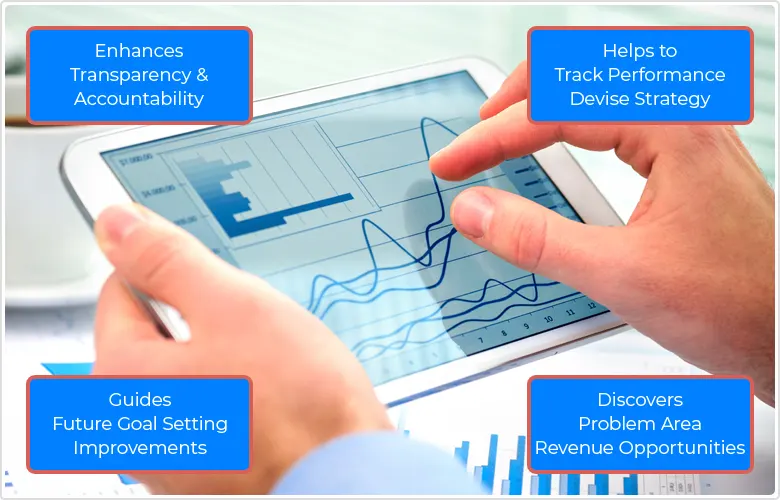
As a person running a business you would definitely agree that constant monitoring and review of business performance is vital to measure your growth and plan your business strategy accordingly. The only way to monitor or track business performance is through business statistics or business data; however like many decision makers the dilemma you would face would be with regard what data to collect and how exactly to collect. Once you start to collect business information that you think is meaningful how would you proceed to convert it into valuable business metrics and leverage their advantage? Here comes the use of an efficient BI dashboard, one that can help you derive some sense out of the data and also converts it to comprehensible business statistics which can drive your growth strategies and development plans. There are a multitude of benefits that a smartly designed BI dashboard brings to your business:
Business data is often raw and difficult to make sense of. This raw information is turned into valuable business insights using Dashboard. It adds value to data and provides a clear, colourful and graphical representation of it, making information easy to assimilate, evaluate and this real-time data becomes the driving force behind business decisions.
Businesses deal with huge volume of data, those related to its operations, workforce, sales, revenue, etc. Even when business operations are automated to a large extend using software, evaluating performance based on business data requires you to consolidate the huge volume of data available in different databases, browse through various individual reports/applications, etc. A BI dashboard offers real-time business data analytics on one screen consolidating all the vital business data.
Dashboards can be best described as progress reports made visual since they provide an easy to understand objective view of current performance. They help review the current business strategy and devise the future one based on facts. Dashboards can be devised to provide metrics relevant to each and every department of your business like – Sales revenue, Customer loyalty and retention, Average number of training hours per employee, etc. These helps review and refine strategy for every facet of your business.
While Dashboards offers business data analytics in the form of metrics and KPIs to evaluate every facet of your business it also offers all key data points on a single screen providing a visual performance measure thus giving a snapshot of not just each team or department but the organization as a whole. This helps every department/function align with strategies and organization wide goals.
Dashboards not only report historical and real-time data, but also help you isolate business areas which are not performing as per the expectation. Example – A poor "Sales Conversion Rate metric" reveals the ineffectiveness of your sales team at converting leads into new customers. Dashboards red-flags problem situation to ensure that attention is drawn to it for analysis and corrective strategy.
There are three basic types of business dashboards which add great value to your business operations. They are analytic dashboards, operational dashboards and Strategic dashboards.
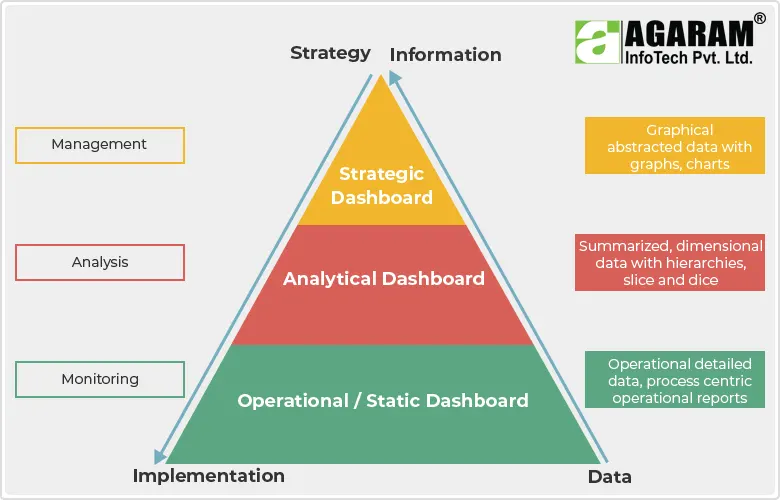
These dashboards are often used by department managers to measure the effectiveness and efficiency of their employee’s work performance, monitor key performance indicators and other performance metrics. Operational dashboards give the user the power to drill through current information, get alerts, and identify potential operational issues as they happen giving the power to make quick decisions without having to dig through large amounts of data.
Analytical dashboards are developed for data and business analysts to perform trend analysis using historical data over months, quarters or years. These dashboards are mostly designed to cater to the requirement of a specific department like marketing, sales, finance etc., and data analysts use different analytical dashboards to compare trends across departments.
Strategic dashboards are designed to provide strategic guidance for senior managers and executives. These dashboards do not provide in-depth information necessary to make complex decisions but offer bird’s-eye view of your business. They summarize performance over set time frames like past month, quarter or year.
Having identified the benefits of BI dashboard and being aware of the fact that there exits Dashboards that cater to the requirements of every level of workforce in the organization ladder, the next question that would be lingering in your mind would be regarding the choice of the best BI dashboard software. The following are the factors to be considered :
Ease of Use - Your dashboards should be collaborative and easily accessible from any browser in any operating system via laptop, tablet or mobile phone. The tool should offer features to create groups of users and facilitate the viewing/sharing of dashboard. The visual appearance of your dashboard should be appealing and it should offer great user experience.
Ease of Customization - Customizing dashboards to suit specific requirements is very critical. The software should offer you tools for easy customization of your various dashboard needs. It should provide access to many visualization widgets that empower you to analyze different areas of your business.
Better ROI - The Dashboard software should be cost effective and offer better ROI. However Measuring ROI from a dashboard deployment is quite challenging because what a dashboard offers is a "soft" ROI. Most of its advantages come in terms of time savings, better access to data and better visibility into business information, all of which are hard to measure quantitatively. However by presenting the target and actual data in a simple visual format to the people concerned it helps achieve tangible targets like reduction of inventory on hand, increase in quarterly sales, minimizing operating expenses, and so on, all of which can be directly measured in terms of revenue / cost savings.
The right BI dashboard software can help you stay informed, relevant and competitive. Invest in the one right for your business and track performance at every step, for it is rightly said by the great management thinker Peter Drucker – “you can’t manage what you can’t measure.”